Methods and Evaluation of Data Quality
Nutrient methods and evaluation of data quality
Dissolved macronutrients include: nitrate NO3- (actually nitrate plus nitrite NO2- is measured, although nitrite concentrations are generally much lower than those for nitrate in the ocean), phosphate PO43 - , and silicic acid Si(OH)4 (sometimes assumed to have the chemical form of silicate or silica, a solid with formula SiO2), all required for the growth of phytoplankton.
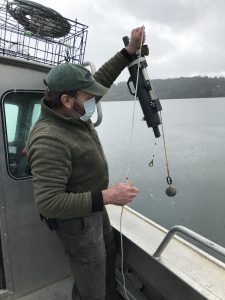
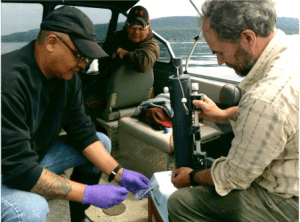
At selected stations, water samples in the CitSci program are collected at depths of 0 and 20 m for nutrient analysis. Water is obtained from a ‘Niskin’-type sampling bottle, attached to a rope marked at various depths and kept vertical by both a weight at the bottom and maneuvering of the boat in the direction of any tilt. These bottles are lowered in an open position, and then closed to trap a water sample using a mechanism triggered by the descent of a weighted “messenger” on the sampling rope.
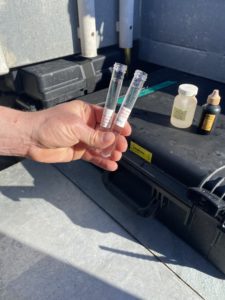
For nutrient analysis, water from the Niskin is subsampled and (from 2016 onwards) filtered through a glass-fibre filter of nominal pore size 0.7 µm to remove all organic matter. The filtered water samples are frozen for storage, and then thawed and analyzed for the concentration of dissolved macronutrients in a laboratory.
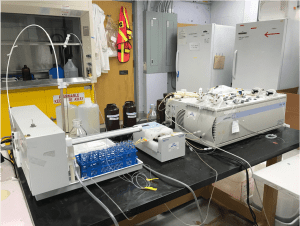
Several different laboratories (and different analysts) have been used over the years to analyze samples in the CitSci program. In most years an autoanalyzer is used to allow for the consistent analysis of a large set of samples.
In general, errors in any nutrient dataset can arise from handling problems (including mislabelling of samples, problems in filtering, and problems arising from not freezing rapidly enough and/or subsequent thaw/freeze cycles), as well as analytical problems in the laboratory, and it is important to consider the effects of these errors.
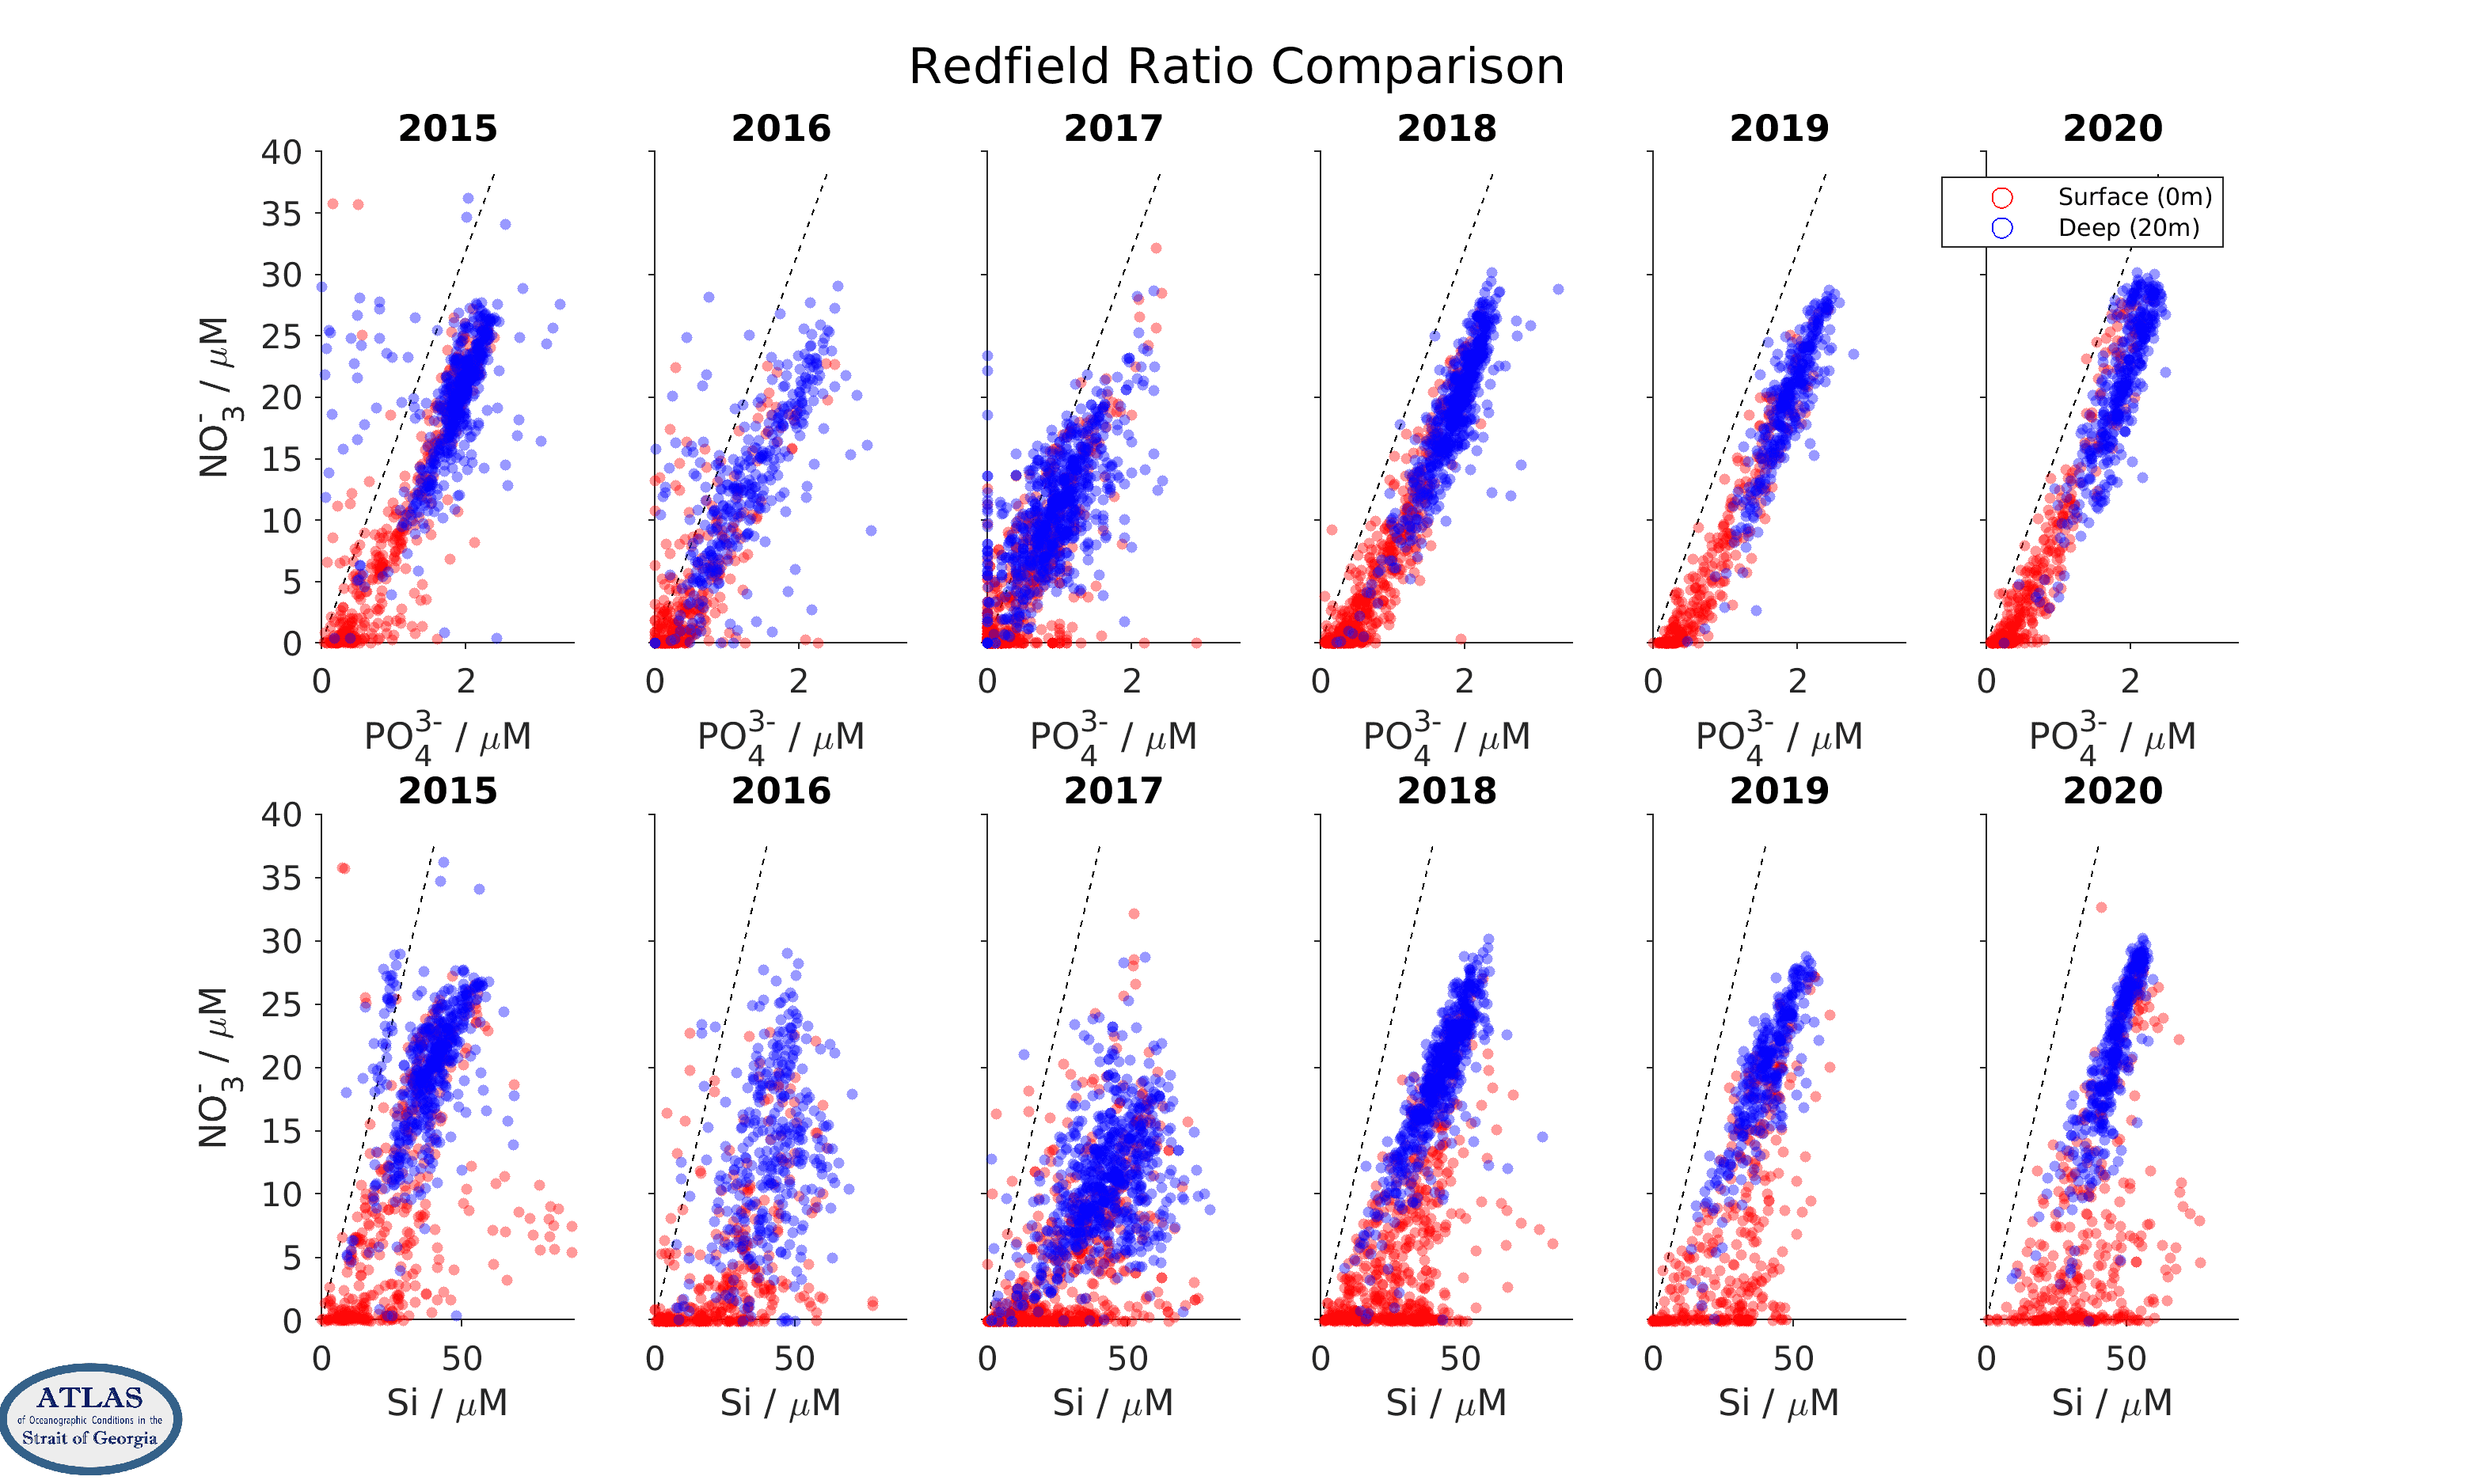
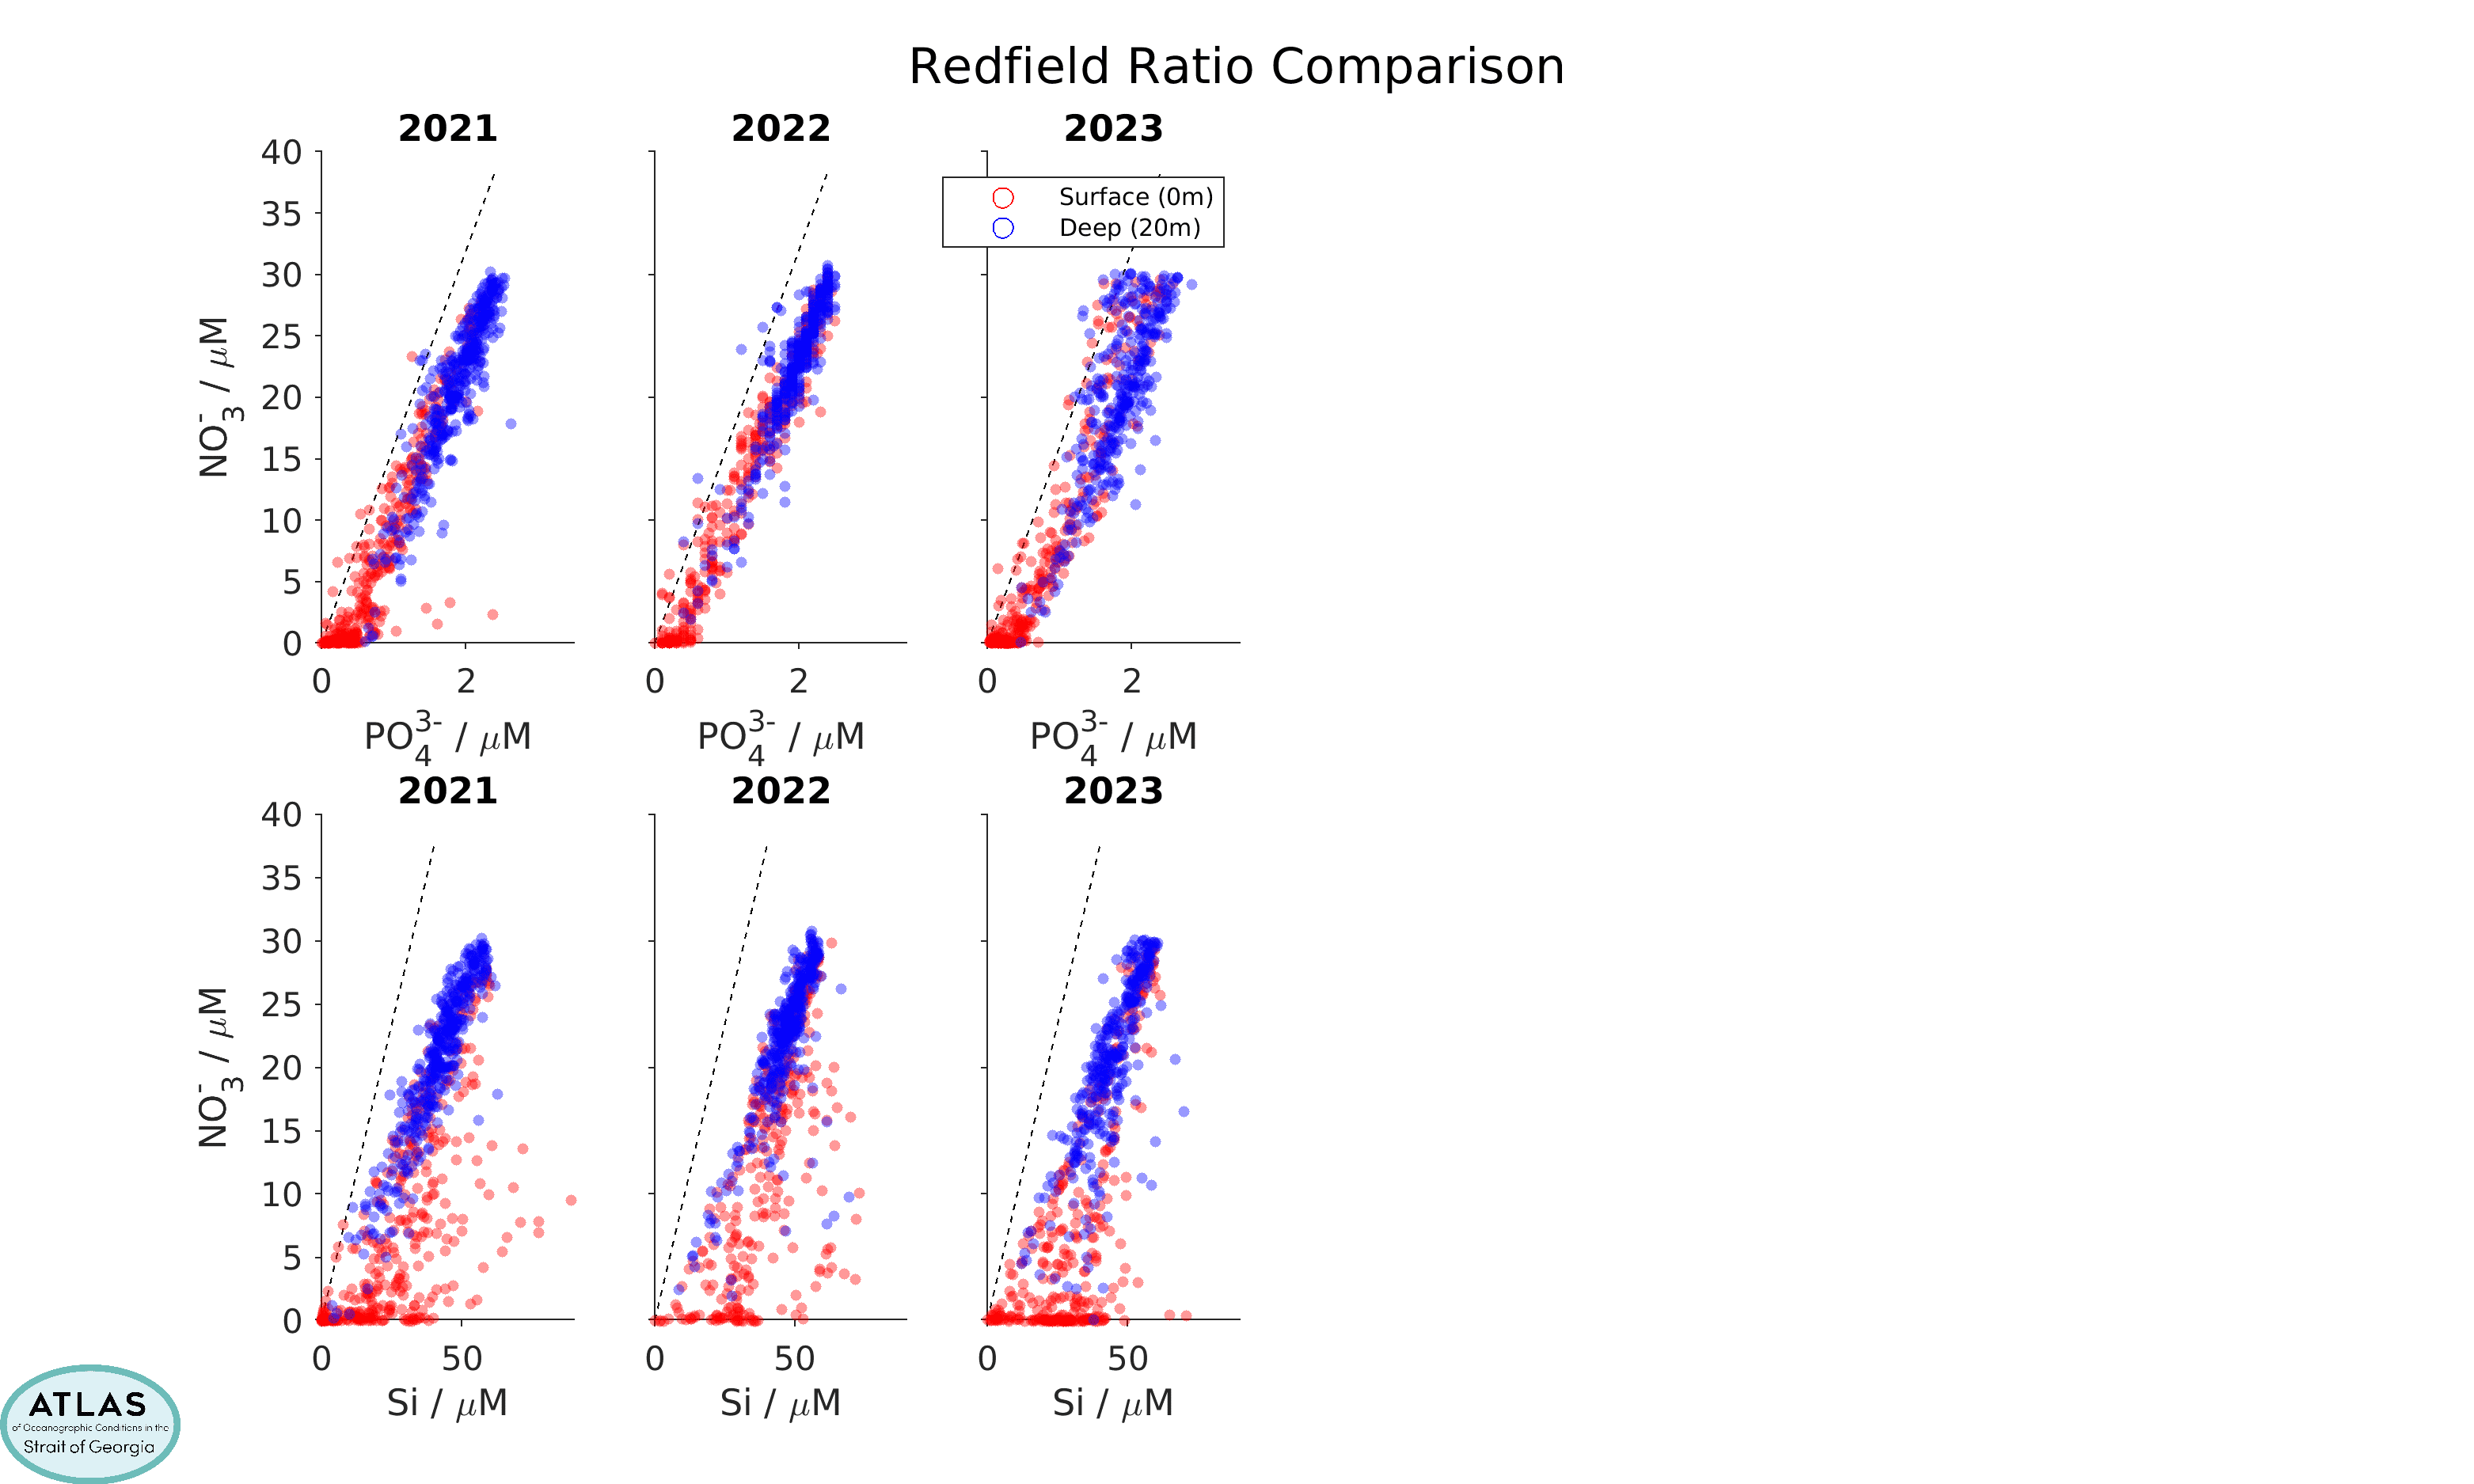
A standard quality-control practice is to examine correlations between the different nutrients in property/property plots. Nutrient concentrations in the ocean generally co-vary in relatively fixed ratios with each other (so-called “Redfield” ratios, for which NO3-:Si:PO43- are in proportions of 16:15:1) because their concentrations are controlled by phytoplankton uptake and remineralization processes, and phytoplankton contain nitrogen, silicon, and phosphorus in (more or less) these ratios. Offsets from curves with these slopes that pass through the origin are often used to infer the effects of denitrification, a microbial process that converts organic nitrogen into nitrogen gas. This is probably not an important part of the Strait of Georgia ocean ecosystem, but may be important in the open ocean regions from which the Strait of Georgia waters are sourced.
Nutrient ratios for CitSci data, by year. Upper row are nitrate/phosphate correlations, lower row are nitrate/silicic acid correlations. The dashed lines indicate Redfield ratios.
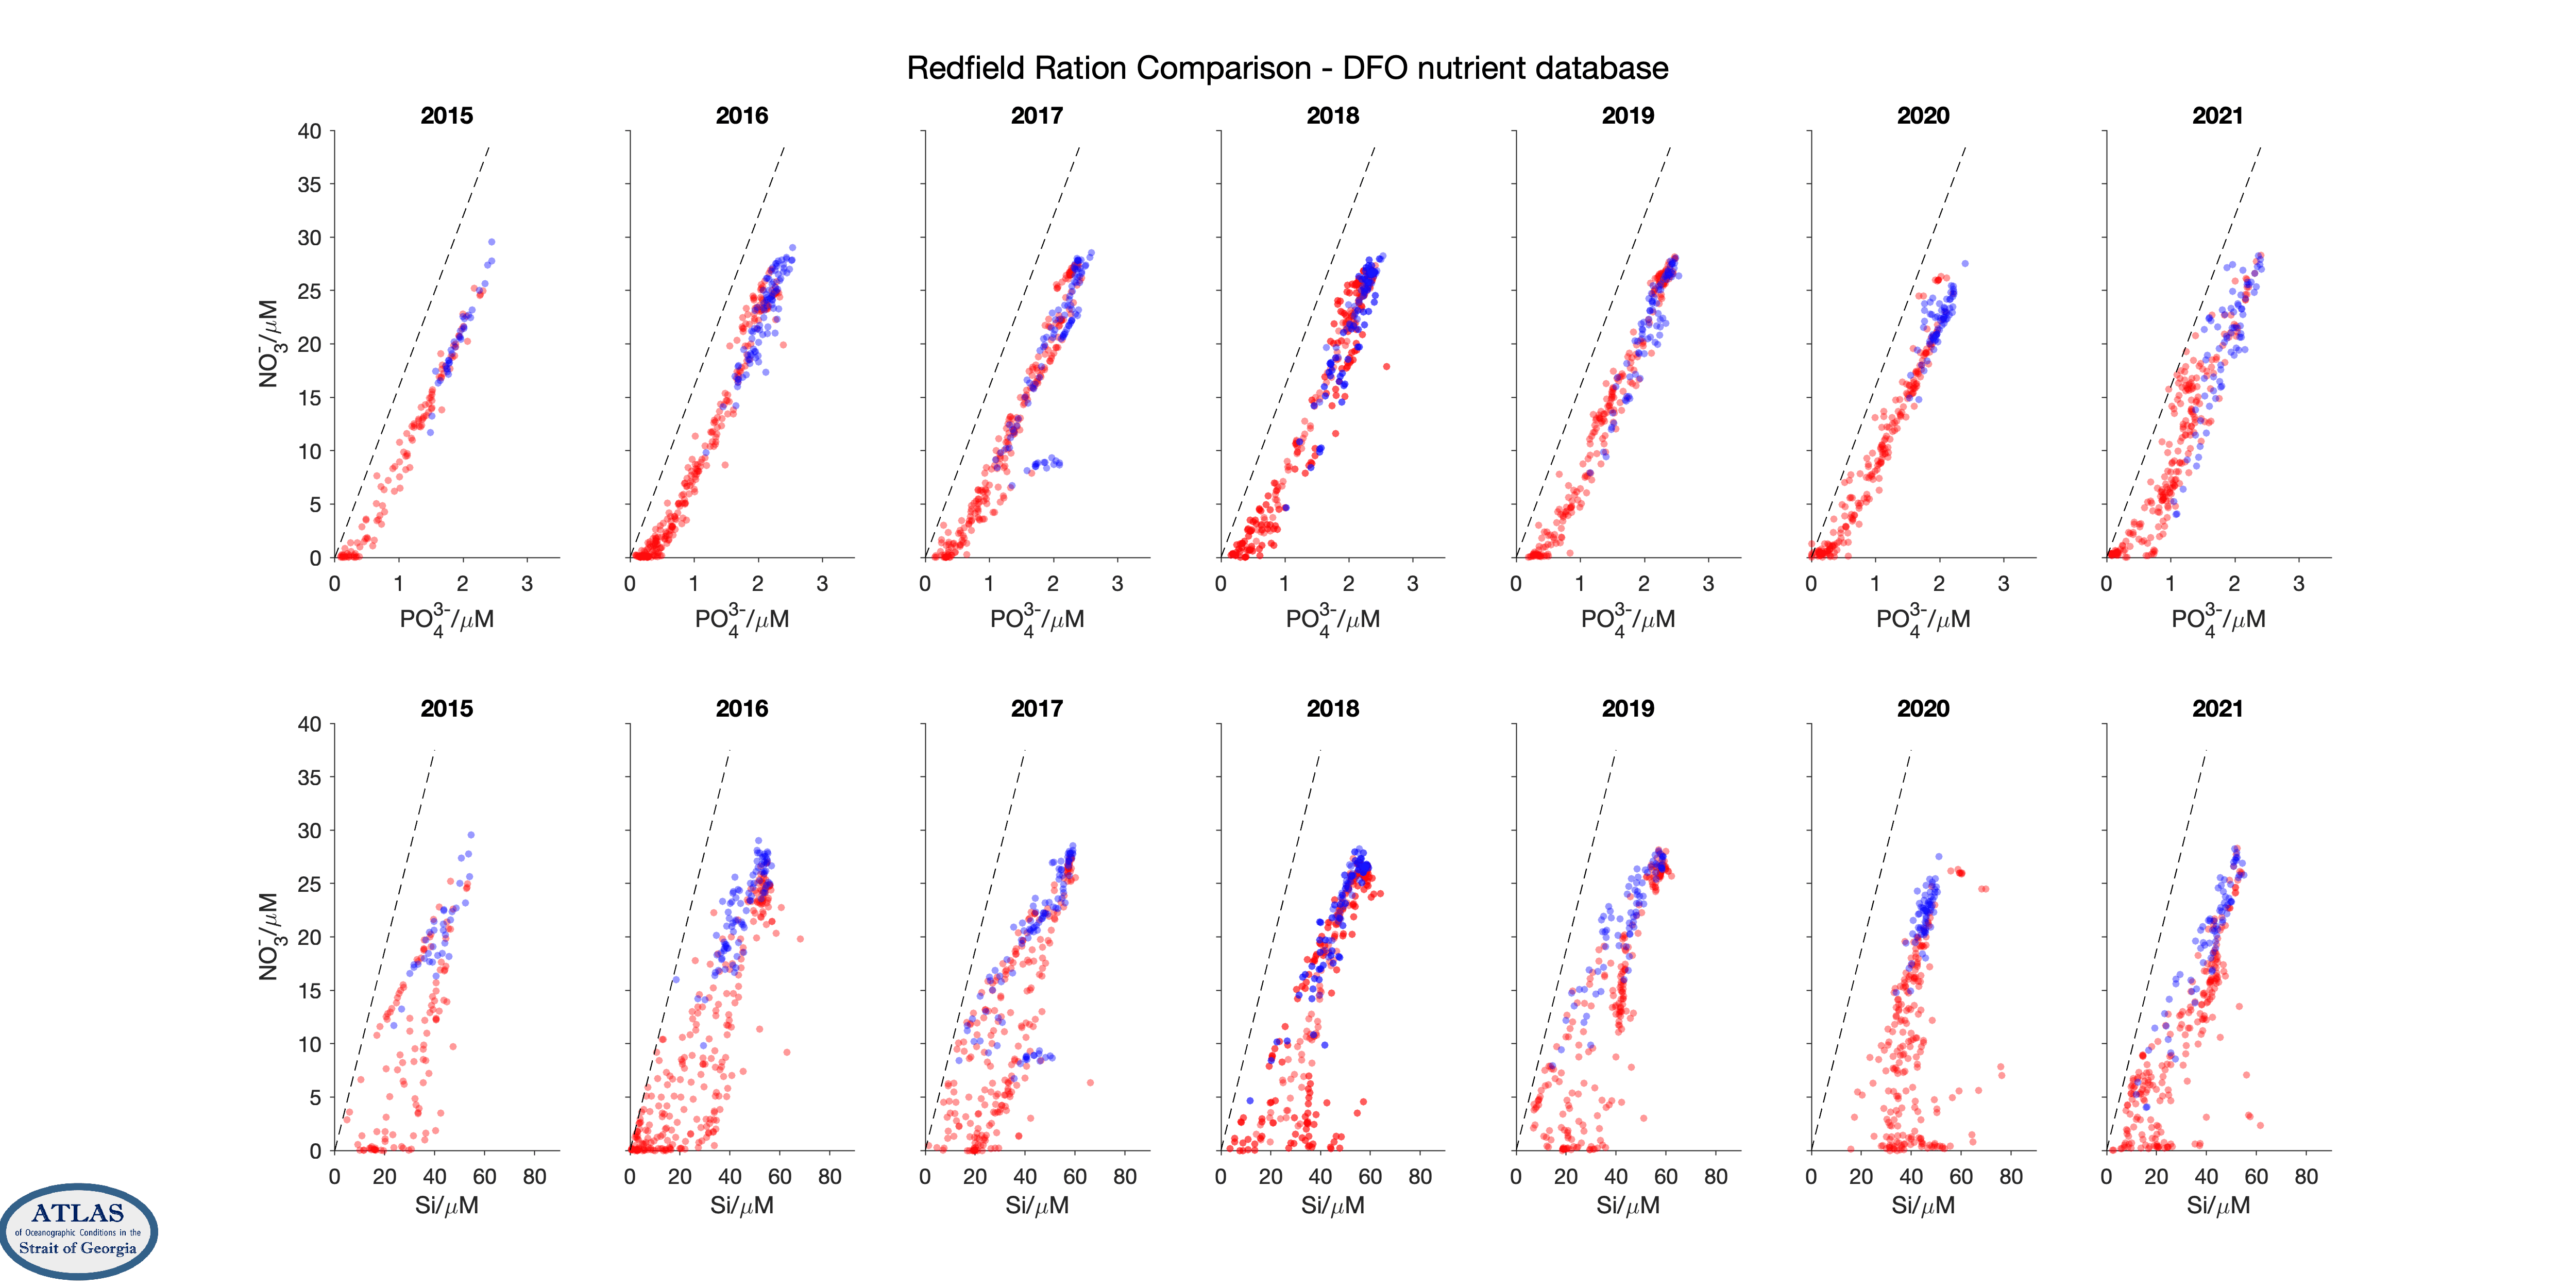
Nutrient ratios for nutrient data from the Strait of Georgia collected by Fisheries and Oceans Canada, by year. Upper row are nitrate/phosphate correlations, lower row are nitrate/silicic acid correlations. The dashed lines indicate Redfield ratios. Although there are fewer stations, this dataset includes samples down to the bottom of the Strait (430 m); samples are also usually analyzed immediately after sampling without being frozen and thawed.
Because of these tight correlations, the scatter in property/property plots can often be used to judge data quality. However, care is needed. Although the scatter in nitrate/silicate comparisons is larger than in nitrate/phosphate comparisons, this effect is also seen in property/property plots for the high-quality data gathered by government scientists during their much more limited sampling program in the strait over the same years. An increased scatter is a reflection of variations in the type of phytoplankton that grow in the strait, as some species use more silica than others.
Note that samples in these scatter plots fall mostly within a dense core of points, but that a number of outliers far from this dense core are also seen. These outliers are quite numerous in 2015 for the CitSci data, but are relatively rare from 2018 onwards. They tend to be absent in the Fisheries and Oceans Canada dataset.
Large outliers in these scatter plots may indicate sample handling problems. This suggests that sample handling in the CitSci program has improved over the years and is now of relatively good quality. Changes in sample handling procedures have included filtering after sampling, more consistent freezing protocols, and purchase of single-use sample containers.
Ignoring the outliers, the scatter in the dense core of the property/property plots is probably more representative of analytical errors in the laboratory procedures. By examining duplicate samples (two subsamples of the same water sample) in the CitSci dataset, which were obtained for this purpose, we estimate that these analytical errors are around ±0.3 µM for nitrate, ±1 µM for silicic acid, and ±0.05 µM for phosphate (see Table below). However, note that the scatter pattern in the 2016 and especially the 2017 CitSci dataset looks qualitatively different than the pattern in other years, with a lower and rounder shape. Deep concentrations are also lower. The reason for this is not clear, however the analytical procedures used in those years were different than in the other years. A difference in data quality for those years is also suggested by comparison with the more limited high-quality data collected by government scientists, which does not show a qualitative difference in the appearance of the scatter over all years. Thus, we suspect that the 2017 measurements especially are also affected by procedural biases. These biases will not affect comparisons within that year, but make year-to-year comparisons more uncertain.
| Duplicate Water Sample Analysis Results |
| Pooled Sample Standard Deviation (Number of pairs) |
| Year |
| 2015 | 2016 | 2017 | 2018 | 2019 | 2020 | 2021 | |
| Nitrate | 0.2737 (336) | N/A | N/A | 0.7594 (304) | 0.1286 (155) | 0.2036 (172) |
0.0950 (195) |
| Silicate | 0.7029 (290) | N/A | N/A | 2.0675 (307) | 0.6404 (176) | 0.6426 (187) | 0.9337 (187) |
| Phosphate | 0.0553 (349) | N/A | N/A | 0.0775 (309) | 0.0378 (159) | 0.0471 (209) | 0.1274 (58) |
| Chlorophyll | 0.1758 (38) | 0.5032 (117) | 0.3018 (147) | 0.3305 (127) | 0.3760 (63) | 0.2540 (97) | 0.3827 (87) |
Table 1: At many stations (typically one station per patrol per survey) duplicate water samples are taken. Shown here are the pooled standard deviations of duplicate samples, after outliers were removed.
A second source of error in this dataset apparently arises from 0 and 20 m samples at a particular location being occasionally misrecorded as the other. Surface nutrients, especially in summer, are known to be often close to zero, and hence much lower than those at 20 m. However, in each year a small number of stations apparently shows the reverse - with near-zero nitrate concentrations at 20 m, but relatively high concentrations at 0 m.
After careful consideration, some of these are assumed to occur due to human errors in the sampling/logging process and are "corrected". In 2020 an improved colour-coding system of labelling for samples from different depths was instituted, and the number of these corrections dropped from about 20 in each year to one or two.


